
Laser Scanning Hakskeen Pan ... or ‘How to produce the most accurate track survey in Land Speed Record history’
By Andy Green
Running a Land Speed Record Car should be easy. Find a perfectly flat surface and then all you have to worry about is the aerodynamics of the vehicle. This simplifies the design hugely – in theory, you don’t even need suspension, as the wheels won’t have to cope with any bumps or dips. However, in reality, things are not quite this simple. There is no such thing as a perfectly flat surface, anywhere.
The closest we can get to ‘flat’ and large enough (12+ miles for BLOODHOUND SSC) is a dried lake bed surface, which is water-laid and floods regularly (ideally every year) to keep it in prime condition. This ideal lake bed surface will have a very smooth surface, but it will not be ‘flat’.
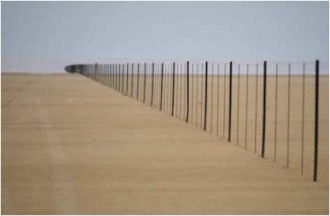 Look closely and you can see the curve
The world is a large nearly-spherical ball, so the lake bed surface will be slightly curved. Local gravity will vary slightly, depending on sub-surface rock formations, etc., and during the flooded periods the water will try to follow these local variations, giving slight undulations in the dried lakebed surface.
During the wet seasons, local rivers flood the lake bed, bringing fine silt and sediment in with the flood water. These sediments are likely to ‘pile up’ is some areas more than others, giving further bumps and hollows. Then there’s the unevenness caused by local rainfall: the rainy season in the Northern Cape is in their summer, with most of the rain from huge showers and thunderstorms, so it can be very intense and very localised, flooding different areas of the lakebed at different times.
![]() Moving 16,000 tonnes by hand
Moving 16,000 tonnes by hand
The result of all these factors is that the surface may look perfectly ‘flat’ to the naked eye, but it’s really a slightly rough, irregular and undulating surface, which approximately follows an ‘equi-potential gravity surface’ on the surface of the earth.
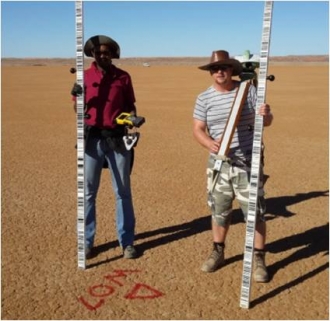
The bad news doesn’t end there. A very large dry lake bed is likely to form a short cut for the local population during the dry season, leaving wheel ruts across the surface. In addition, the surface may be covered in stones which have been washed in over thousands of years – this is certainly true for Hakskeen Pan, where the Northern Cape team has removed over 16,000 tonnes of stones, by hand. All of this adds to the roughness and irregularity of our supposedly ‘flat’ desert surface.
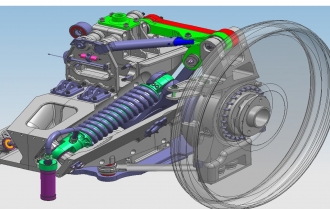 Good suspension is a must
Two simple conclusions follow from the above description. The first is that our Land Speed Record Car is likely to fare much better if it’s got some good suspension to cope with the surface bumps and dips. This is why BLOODHOUND SSC has independent double-wishbone suspension on all 4 wheels. The other thing we need is to know is what the suspension will have to cope with. In other words, just how ‘rough’ is this desert surface?
I first put this question to a small survey company in Cape Town called Lloyd & Hill, 5 years ago. Thanks to a huge amount of work by Gavin Lloyd and his team since then, we now have the most detailed map ever of a Land Speed Record track. The answer to our ‘how rough?’ question is that the Hakskeen Pan surface appears to be smooth enough for a 1000 mph Land Speed Record attempt. This simple statement is based on what is, we believe, the world’s largest precise survey of a natural surface.
 16 km, 8 billion laser measurements
The task we set for Gavin and his team was to scan the whole of our 20 km by 500 metre wide track surface, measuring the elevation (height) in each square metre, to an accuracy of 10 mm or less. That’s 10 million precision measured points, just for the main track surface (the safety zones either side were also scanned, which doubled the task). It’s fairly easy to measure one point accurately, or even several (surveyors do it all the time), but 10 million points spread over 10 million square metres? That’s not practical… until now.
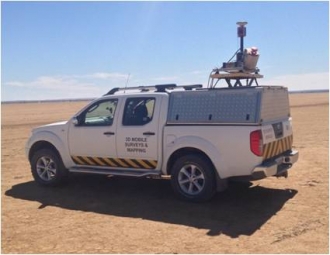 High-speed scanning…
New laser scanning technology (and some very clever work by Lloyd & Hill) made it happen for us. To reduce the task slightly, we decided to ignore the first 3 km of track at the northern end (which is very smooth) and the last km of the southern end, where BLOODHOUND SSC will be travelling very slowly anyway. That still leaves us with 16 km by 500 m (a total of 8 million sq m) to scan.
The survey theory is simple. Put a very high speed scanning laser on top of a vehicle, drive it up and down the desert until you’ve scanned the whole track, crunch the resulting 3-dimensional surface ‘map’ through a computer, and wait for the results to fall out.
 …and 290 reference points
Unfortunately, in the real world, it’s nowhere near that easy. The team mounted the laser head on top of a vehicle, which then drove up and down the lakebed for a total distance of 300 km to ‘map’ the whole track surface. Of course, the laser is only measuring the distance from the surface to the laser head, which moves as the vehicle moves up and down, and rolls from side to side, on its suspension. Even if you use a computer to compensate for the suspension movement, that still leaves you with the problem of knowing precisely where the vehicle is (to a vertical accuracy of less than 10 mm) all the time. The solution is to pre-survey 290 precise reference points, spread over the whole track and accurate to +/-2 mm, so that the laser ‘map’ can be matched precisely to these known elevation points.
The other problem with a vehicle on a desert is that it’s on wheels, which kick up a plume of desert dust, even driving slowly. This gave the laser system its biggest problem. The dust blocks the laser signal reaching the surface behind the vehicle, and gives false returns from the dust cloud instead. The laser scanner uses a sophisticated technology called ‘full wave form analysis’, which stores multiple returns from the initial pulse. However, the dust cloud was often too dense for this technology to achieve a true ‘last return’ from the surface. To deal with this, the team filtered out the signals immediately behind the moving vehicle.
 Smooth, cracked or crumbly – take your pick
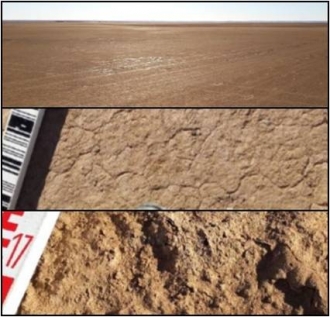
So much for sorting out the problems of scanning from a vehicle. That still leaves the problem of the varying types of desert surface. Depending on the local soil conditions and the rainfall pattern, the surface may be super-smooth, cracked, crumbly, or some combination of all 3.
These surface changes make no difference to a 7 tonne supersonic Car, but they can have a big effect on what the survey laser sees at any one point. To get round this, each square metre was scanned at 500+ different points, and then averaged to produce a single elevation for that square metre. In other words, for the scanned track area of 8 million sq m, the team sampled over 4 billion points with the scanning laser.
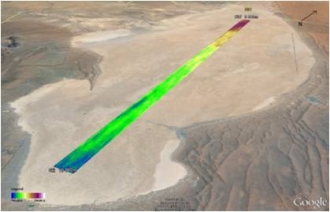
 One foot in 10 miles
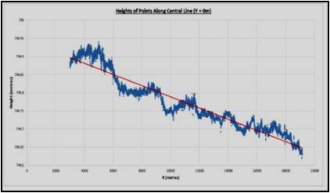
So, 4 billion points later, what does the world’s most precise surface survey show us? The good news is that across the whole surface, the biggest ‘bumps’ and ‘dips’ are less than 50 mm from the average elevation. Plotting the vertical differences from the surrounding area, and colour-coding the result, clearly shows the ridges and ruts across this apparently ‘flat’ surface. The most obvious changes are at the old causeway, which ran across the northern end of the track.
The initial results gave us some surprises. Hakskeen Pan has a very gentle slope from north to south. By gentle slope, I mean 300 mm in 16 km (about one foot in 10 miles), so we could regard it as perfectly level. The rainfall doesn’t pool at the southern end, showing that even the water regards this surface as level – surface friction and the wind have far more effect than the tiny north-south slope.
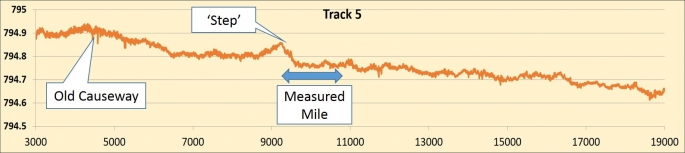
Another surprise was what looks like a big ‘step’ running across the Pan, just over 9 km from the northern end of the track. This caught my attention: the measured mile starts at that point, so the Car will be travelling at 1000 mph right there. Time to look at the details and try to answer the original question of ‘how rough?’ is the Car and the suspension going to find this.
 The detailed profile
The ‘step’ is larger at the western side of the track, with an elevation change of about 80 mm in a distance of 180 m. That’s a slope of 0.026 degrees. It’s nothing… unless you’re doing 450 m/s, when the Car will drive up this ‘step’ in just 0.4 of a second. That’s going to make the suspension, and the Car, move a long way in a short time. 78 mm is a long way in 0.4 sec…. or is it? I’ve built a very basic model of the suspension, to look at the peak loads (this is one of those times when it’s really useful to be a mathematician). This apparently large ‘step’ results in a bump of less than half a G, and if you add the effect of the Car’s suspension dampers (which smooth the bumps out), this drops to under a quarter of a G. The suspension is designed to cope with up to 4 G (up to 4 times the Car’s weight), so a quarter of a G is hardly worth mentioning.
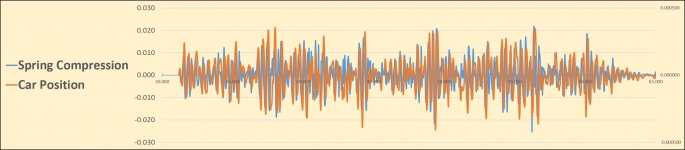
Suspension Modelling – fancy a go?
Slightly more interesting is the series of bumps and dips around the causeway. We’re still analysing the data, but I can’t find anything that gives us more than about 1 to 1.5 G, so everything looks to be well within the Car’s comfort zone. There’s plenty more data to look at though, so if you’ve got a background in suspension modelling (or a university student looking for a project) then please get in touch – we’ve got a unique piece of research for you to get your teeth into!